Sorry if this has been discussed, I searched for all topics containing ‘debug’ but didn’t find anything like it.
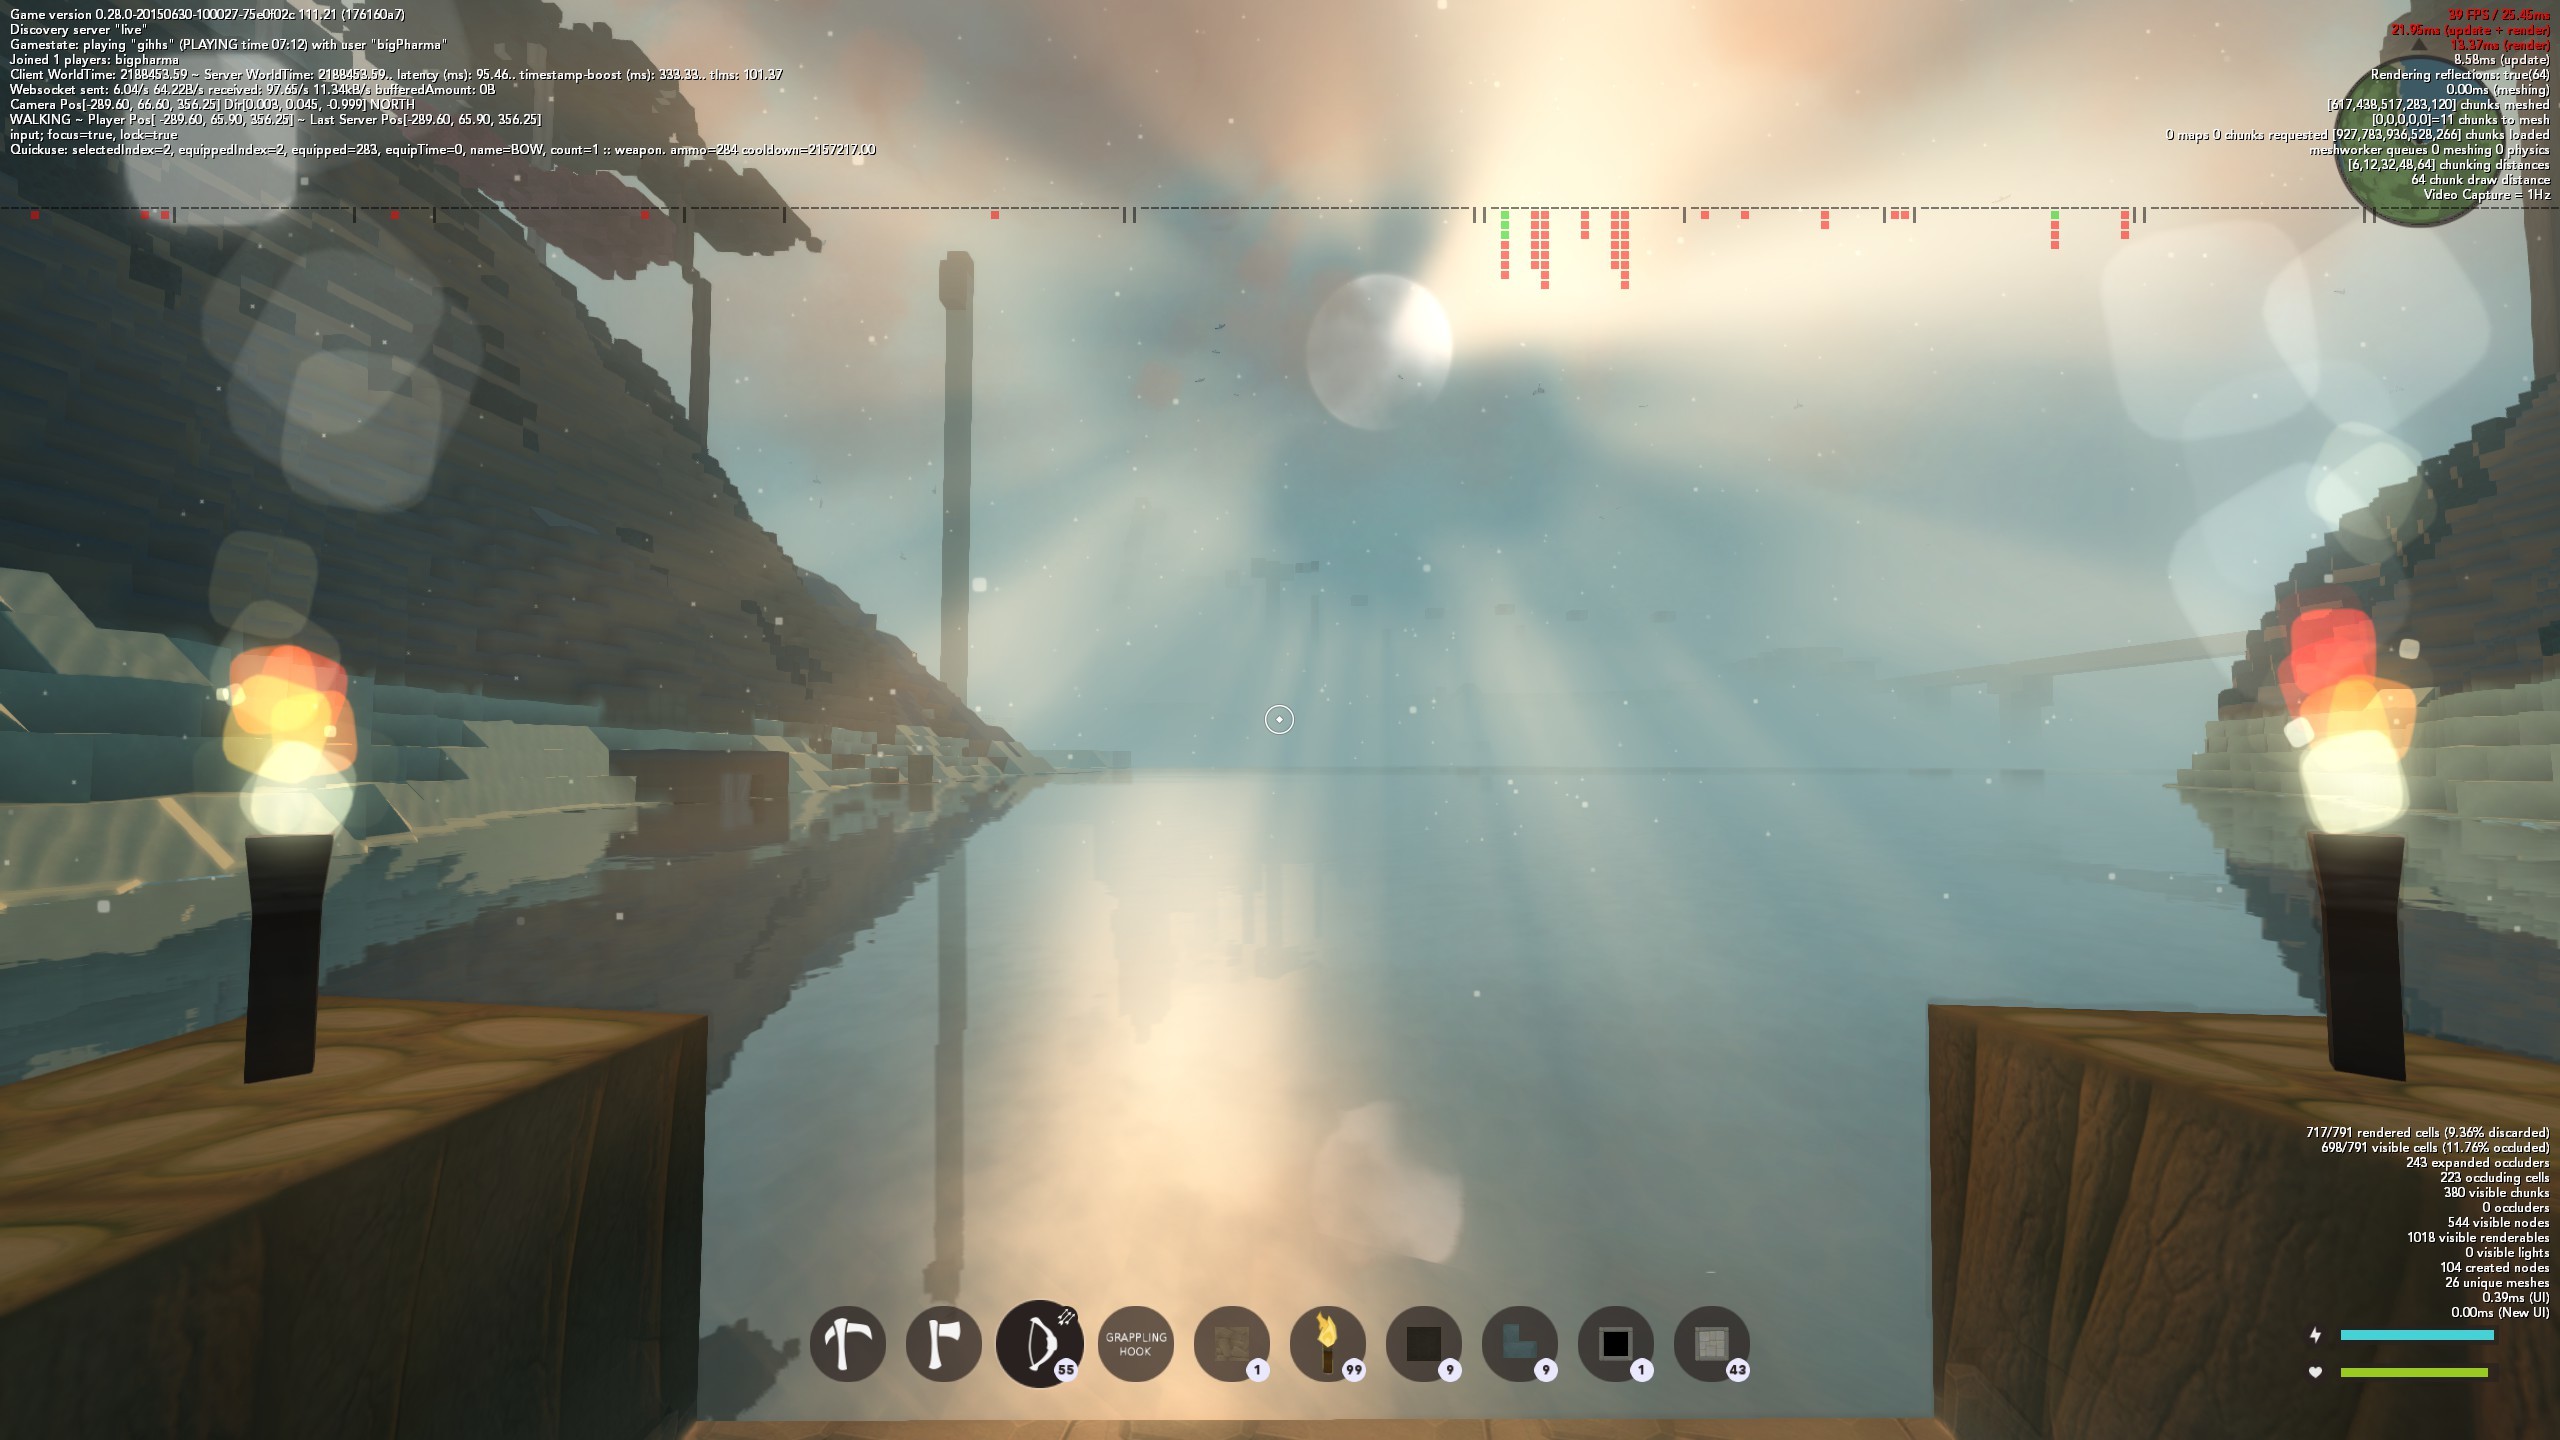
LOW PRIORITY (obviously), but as a software developer, I’;d be interested in what the debug blocks represent in the view shown below. I realize this may open a ‘can of worms’ and may require a more in-depth discussion of the engin - or more specifically, the voxel engine/logic which sits on top of the Turbulenz framework. Just wondering.
That debug rendering is displaying information about the efficiency of the occlusion system.
If I remember correctly, the first half of the groupings are for the main view, and the second half are for the reflection camera angle. Within these two halves are metrics for each chunk LOD. Then within each section the different colours of each box represent how many chunks(?) a cell in the occlusion system is eliminating from the rendering. A blue box represents 100s, green 10s, and red 1s. (So basically the more boxes the better, the more blue boxes even better.)
In this view there isn’t much opportunity for occlusion. If you wander around and stand looking at a mountain you should notice a difference.