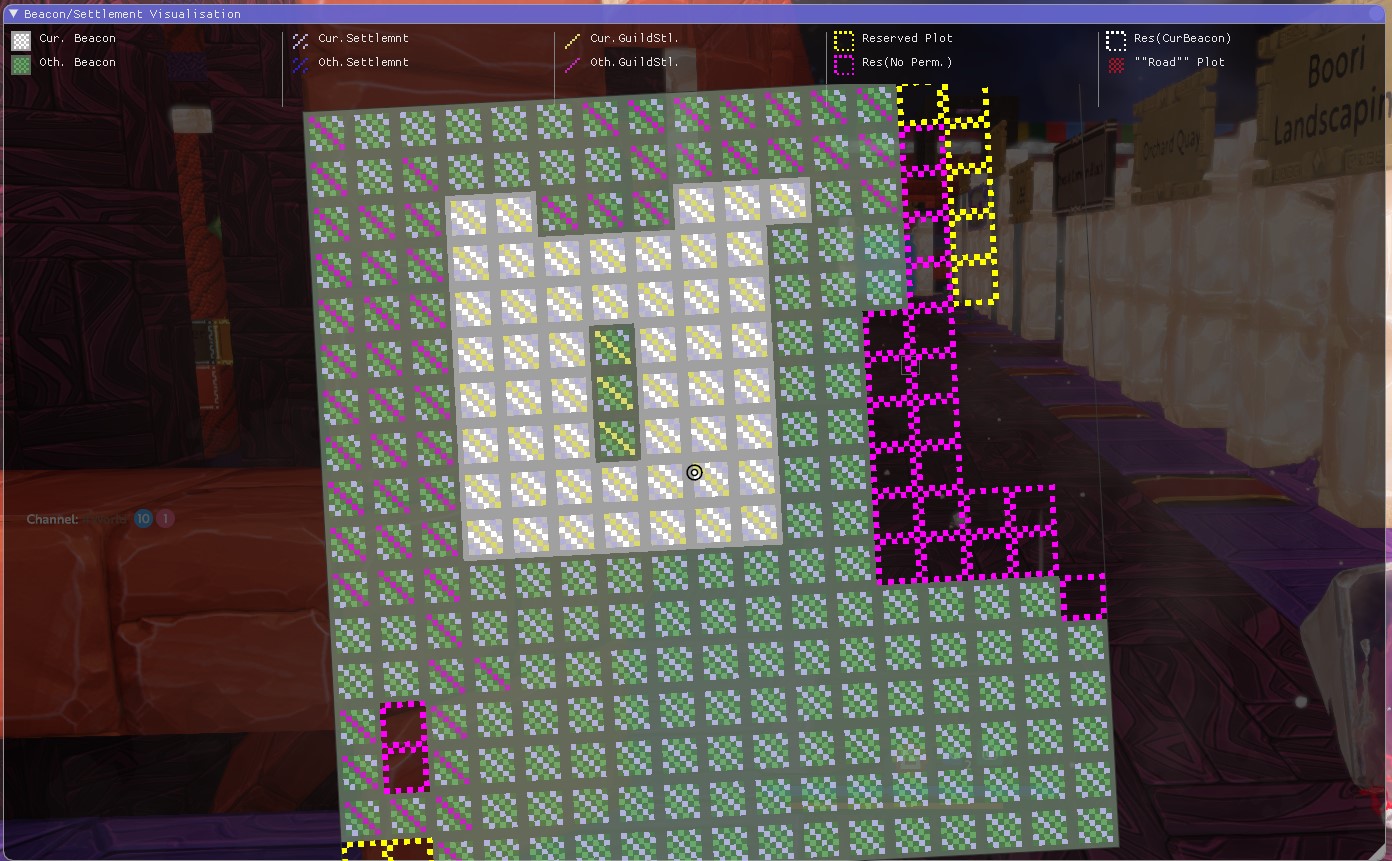
Can anyone point me in the direction of a post about, or just give me the details on the plot viewer? I see gray-bordered plots, yellow-bordered plots, white plots, green plots, yellow plots with like a checker board pattern, green plots with a red x… Some of these I’ve pretty much surmised what they mean, but I can’t find any info on what all the different plot icons mean when looking at the plot viewer. Any help?