I posted about the OBIA shortly after I came up with the idea, but I’ve modified it in multiple ways and feel like sharing the first 17 weeks (OGC years). To those who haven’t seen this- it is in no way a real metric of the economy. At most it should reflect player activity over time, but always to be taken with a shard of rock salt. It’s just a fun way to play with spreadsheets and add some immersion to the universe. Plus I’ll be using the data for certain builds in game.
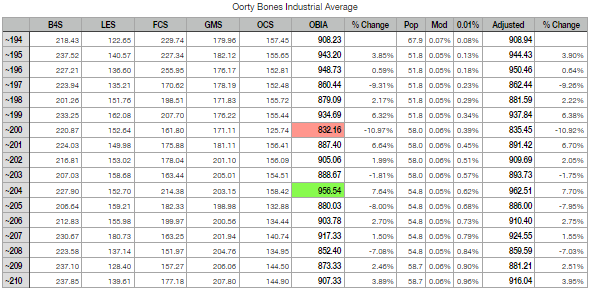
The OBIA is made up of 20 items that cover as wide a range of the full item spectrum as possible, by association through crafting etc., divided among 5 sectors. I won’t get into the formulas here but basically we want item prices to decrease and total volume to increase for the index to rise.
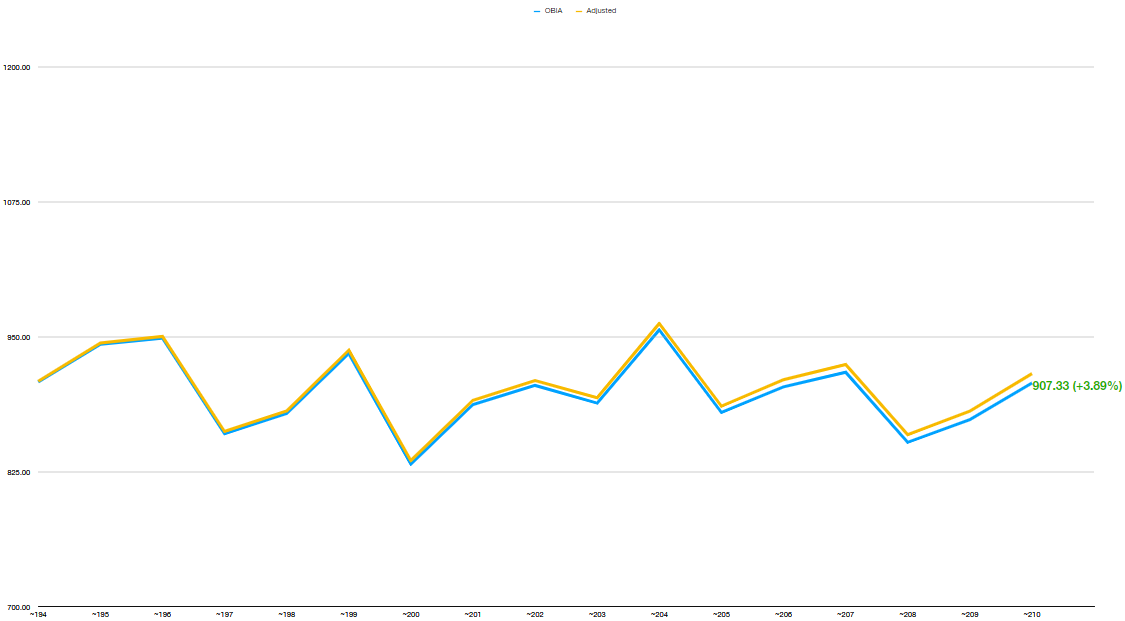
While that should certainly result in growth due to (hopeful) increased player count over time, I anticipate the true chart will forever be a mess of long plateaus separated by sharp rises and falls in player count, so this week I came up with a natural way to mimic the effects of inflation. It hasn’t shown much after only 17 weeks in but I’m excited to see a nice logarithmic curve develop after some months go by and the chart looks more realistic.
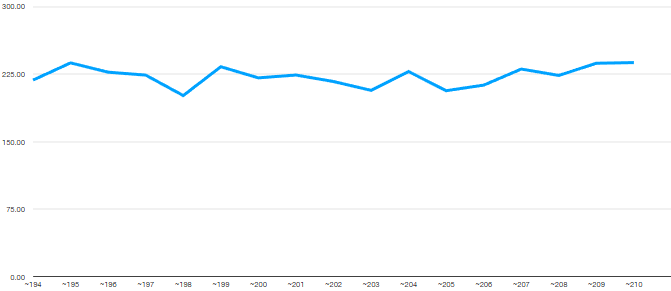
Anyway, here’s some chart action:
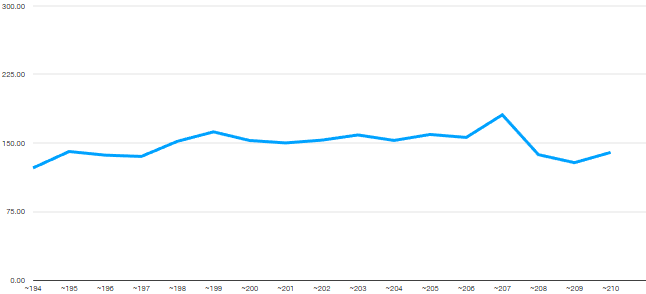
Odubon Construction Sector, up slightly this year to 144.90.
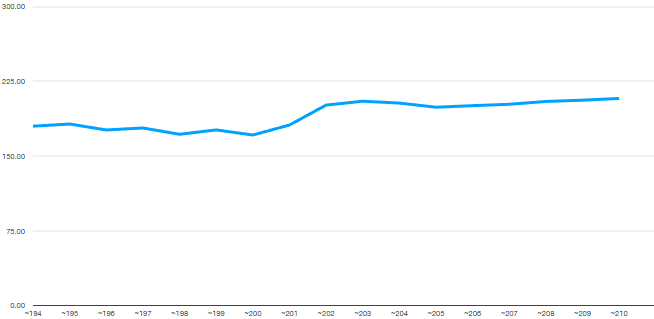
Gordon Manufacturing Sector hit an all-time high at 207.80.
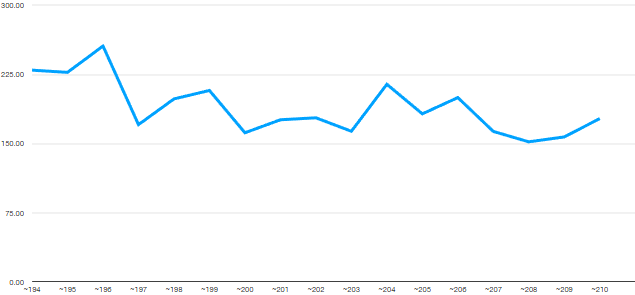
The Foxx Commercial Sector is up 12.66% to 177.18, bouncing back from its all-time low of 2 years ago.
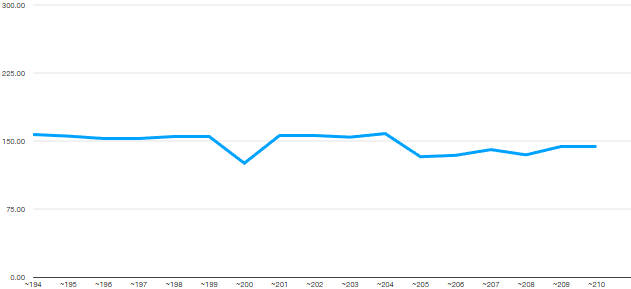
Luckskill Extraction Sector is regaining balance at 139.61 after a surprising streak of volatility.
The Buff-4 Sustenance Sector finishes just ahead of last year’s all-time high at 237.85. Can it continue the streak into Y~211?
I’d love more detail on how your indexes are calculated (basket contents, calculation methodology, etc) - it would provide a lot more insight for us shopkeeps. Inflation data is absolutely critical to a stable economy.
I’m very interested in the long-term stability point of the economy (which is a real thing with no macro disturbances from patches) - if we know (roughly) what to aim at (as statistically derived) a lot of producers and consumers will adjust trade patterns closer to a convergence.
Also: I’m approaching a lot of calculations from a cost matrix. The bulk of coin is directly produced by player time and not by a central control. We thus get an optimal (true) ratio of coin vs goods. This is evident from the minting chains - and points to the current market being short on coin. This should lead to some short-term inflation since I am already exploiting this fact and many others will as they discover parts of these value chains.
Other interesting fact: hoarding produced goods in a market visible way is complex in Boundless:
Only the volume of items at the lowest price from a single provider shows in shop indexes
Adjusting volume in a store is hard: adding a bunch of shop stands / req baskets normally requires moving other stuff which forces entire layout changes for most.
From this fact you can assume that coin supply will always show behavioural changes long before goods supply does.
Just checking the forum for the first time since posting… I had totally forgotten I posted this thread
As much as I wish there was some legitimacy to this, I’m going to have to disappoint you. The only info I have available is the price and volume as shown on BUTT at the time I look it up. Without knowing how much of an item actually sold vs inventory added, I do not believe it is possible to truly gauge the economy in the game.
I didn’t want to muddy up the original post explaining the calculation because I need to emphasize that it holds 0 statistical value in a real world analysis. It’s nothing more than the volume of an item divided by the BUTT price (average of top 10%)… Let the insignificance of that quotient sink in for a moment. This index does not provide insight into the value of goods sold, and is not a legitimate metric of the flow of coin.
Now allow me to give that quotient some measure of significance. When player activity is higher, volume of goods is generally higher. Apply basic economic principles here, price decreases. I can’t speak to volume levels in more active times but I remember the price of rough oort being under 200 more than once. I’m sure there are screenshots out there that show volume too. So whether price decreases at the same volume or volume increases at the same price, the quotient will rise. That’s why I think it will correlate with player activity over time and will incidentally appear to track the economy.
I can go into more detail but I’ll cut this reply off so you can decide if you even care after reading it . Again, it’s just for fun and lore. And a way to apply my calendar to something

 . Again, it’s just for fun and lore. And a way to apply my calendar to something