Just wanted to update this chart after four auspicious weeks saw the Oortigalactic economy rise from the depths of depression to exciting new heights with no signs of slowing! REMINDER This is all dramatization based on a few formulas I tied together and is not a legitimate metric of the economy.
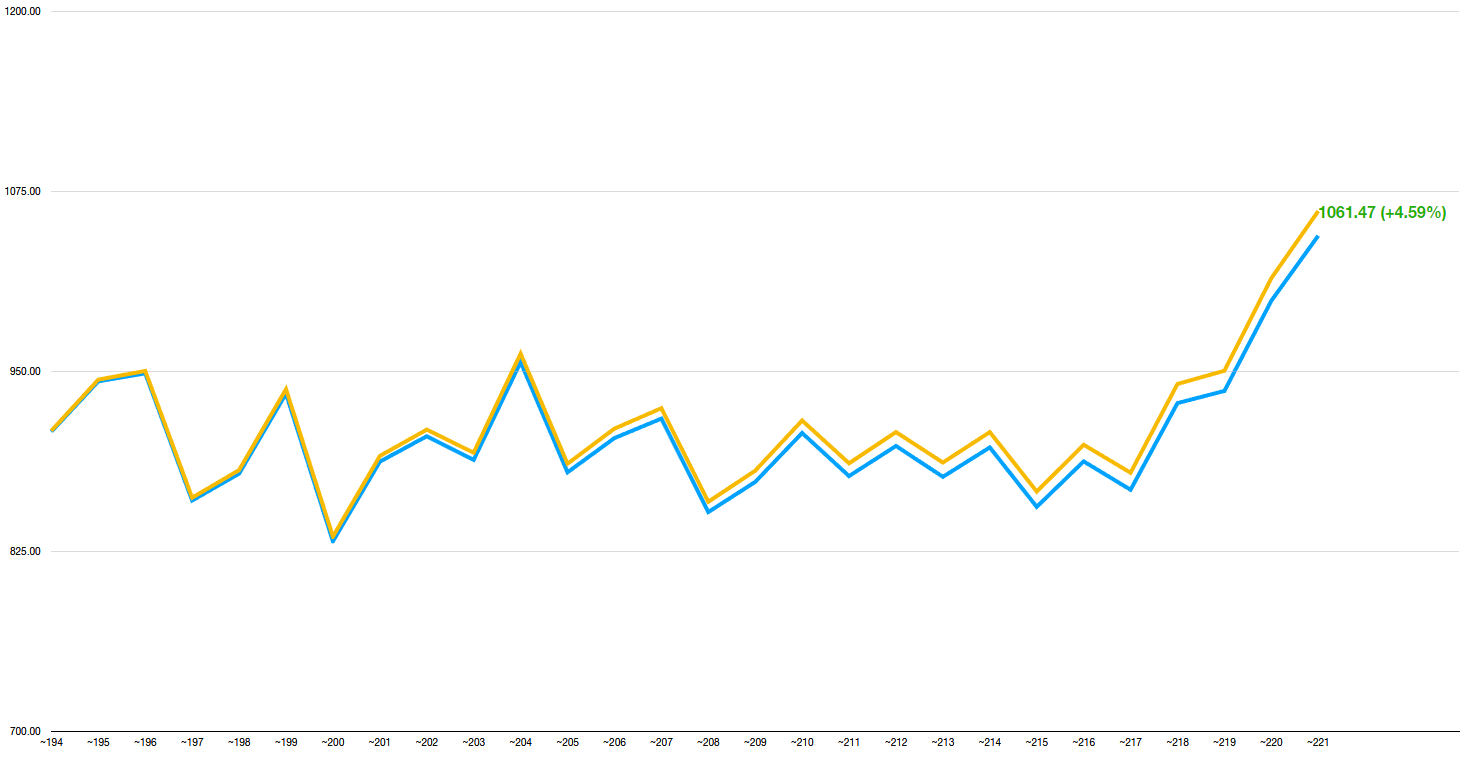
It’s becoming clear that this is an accurate depiction of overall player activity, considering that the steam player chart has shown an increase in players under ‘Last 30 days’ for 8 straight weeks. I’m using those numbers to create a compounding pseudo-inflation value (the orange line’s value is the blue line’s value plus the ‘inflation’ bonus) that will give the impression of sustained growth in the long run. After a couple human years, the 28 weeks of volatile data we see in the present chart will be condensed into a relatively stable fraction of the index’s history.
This has been a lot of fun to track over the last 6 months and I’m always giddy when it comes time to update it every Wednesday night, or Humpmonth as I currently call it on my calendar… I’m not suuuper great at naming things… Anyway, thanks! I’ll wait a good while to update this post after we hit new levels of excitement in the future.