Regeneration Update

Hello all,

Over the last couple of weeks we’ve been analysing the world and resource regeneration. Generally the system has been performing well; however, on one particular world we were seeing the regen system lagging behind the amount of changes being made, which was causing scarcity of resources as well as performance issues on the server. To combat this we made some configuration changes and have been monitoring since, and I thought I’d share the results with you.

The two changes we made were firstly to increase the speed of regeneration, particularly when there was lots of regeneration needed to be done in a given area, and secondly to batch the changes together more to relieve pressure on the machine. Here are the graphs of the key areas of this system over the time:

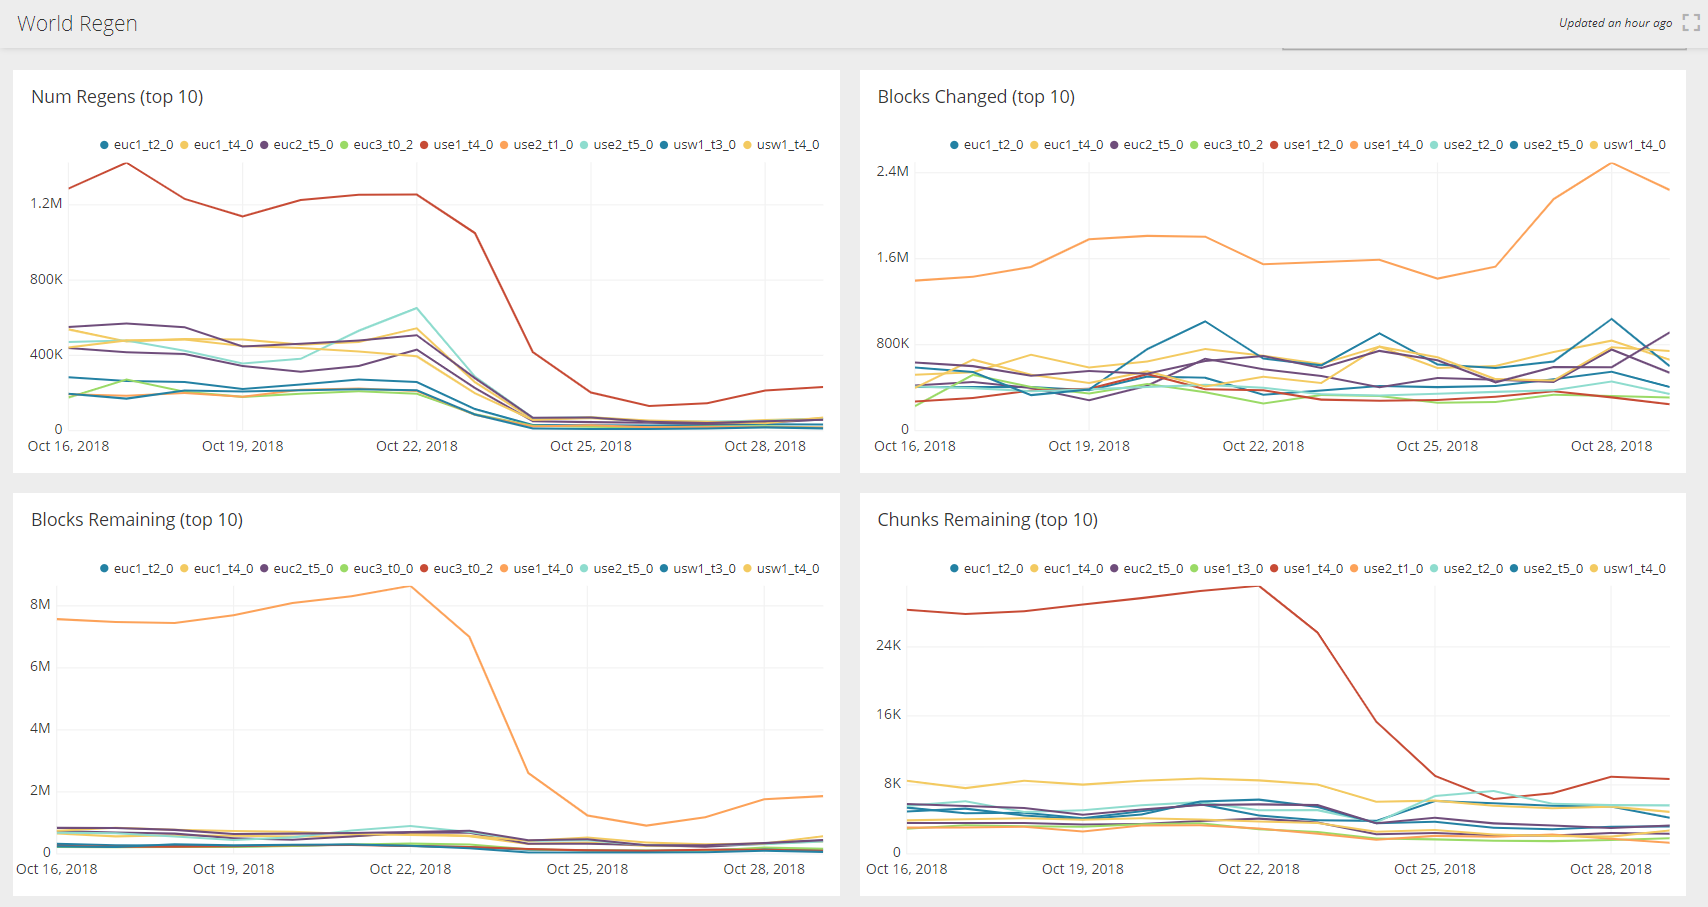
Each graph shows values per day for the ten worlds with the highest values in that particular category. The key at the top of each graph shows you the (internal) world name for each colour for that graph. Because each graph sorts itself by the highest values, the colours do not exactly match-up across the different graphs.

The top left graph shows the number of regeneration changes that each server made over the period. This is the key metric for server performance as every change costs processing time and time to write to the disk. You can see that dropped dramatically for all worlds.

The bottom two graphs are the amount of regeneration that is remaining at that point in time, and they go down equally dramatically. Bear in mind that the top left graph is showing a reduction in regeneration work done, and the bottom graphs are showing the amount of regeneration has hugely increased. This is because of the increased batching, and how that has interacted with our resource limits allowing more to be done over time.

So those three graphs are showing the system performing better and coming closer to the behaviour of the other worlds, but you’ll notice our problematic world is still tracking somewhat above the other worlds in all those metrics. This is where the top right graph is interesting – it shows the number of block changes made. Our troublesome world has always been significantly higher than other worlds, but also during this period of improved performance the amount of block breaking has actually increased, so the system has been performing well under an even higher load.

Overall I’m confident this shows the system is now working as intended and regeneration will keep pace even in the most extreme situations.

37 Likes

I guess this was done behind the scene over the past few days/week? I had noticed some resource return rates having been improved on the troublesome planet (let’s be real, we know its Serpensarindi)

13 Likes

Under the updated system, when would you expect a full regeneration of said world. Previously I believe someone suggested a chunk, with bo interference, would take like 150~ish hours for a full recovery. Has this estimation changed?

1 Like

Thanks for the insight! Does look like it’s improving at a good rate.

For my interpretation of the graphs: do the data points at the end of each graph represent a partial day?

2 Likes

They may not answer this, as to not give the exact timing away for those calculating their alarm clocks.

1 Like

I’m assuming that those graphs are aggregated (sum/average/etc per day), and that the actual work happens more frequently/evenly across each day

2 Likes

Interesting read :popcorn: and thanks for the update ^^

5 Likes

Thank you. This allows some players who may believe you guys are not watching or monitoring the games data, think otherwise.

4 Likes

Almost 2x! Is that us players responding to resources (cough diamonds) coming back after the “pay down” on Oct 23-25?

1 Like

I have been seeing a lot more diamonds come in the later half of the week and this past weekend so yeah, feels good

2 Likes

As this was a good post I think you have seen a huge dip in players mining this planet because most of us got fed up with the sad regan.

Now watch your data closely as we go back out to mine and tell us what you see.

1 Like

The best fix for the top right chart is a new set of T5 planets, and everybody happy :slight_smile:

2 Likes

At that extreme case, it’s down to about 85 hours.

2 Likes

Those are full days at the end (ending at the 29th). The downturns on the Blocks Changed graph are in the data.

1 Like

The name in the graph is ‘use1_t4_0’. Are we sure that’s a T5 world? That assumes they number from zero in their internal IDs, which would make sense but afaik isn’t confirmed. Could it actually be a T4 world, maybe Delta Cancret (shimmering orbs)? From what I understand growth gathering tears up a lot of the landscape…

Edit: ollie confirmed below it is Serp

2 Likes

Thanks for the update. Real world experience: I went back to Serp after a long break doing other things and I found it much better. It was fully regenned around the area I was mining on night 1. By night 3 all my tunnels were gone when I revisited.

3 Likes

Internally they’re 0-indexed (judging by game files) - level 1 worlds are t0 worlds

2 Likes

Thank you for that confirmation. That’s a helluva job tweaking. It’s definitely been noticeable. Thanks for plugging away at it.

2 Likes

Thank you for sharing this information with us. Really appreciate you taking the time and being open.

I concur with others that the changes seem to track heavily with player populations.

I also wonder about the impact of regen bombs. I know I and other have been using them more often recently when mining. Do you have the ability to track natural system regen vs regen bombs?

1 Like

Yes, the Num Regens and Blocks Changed are sums over the day, and the Blocks Remaining and Chunks Remaining are averages (mean).

The system ticks every half a second, evaluating which chunks should be regenerated. Each chunk can be regenerated no more often than once every 180 seconds, and at most waits 4000 seconds.

3 Likes